The right time and the right days to publish your best post?
Want to see if your posts are getting the red flags like Hide or Report as spam reactions? Not sure if you are getting the likes from the age group, location, or gender that you’d like to target?
You can get the answers to all these questions and a lot more through Facebook Insights.
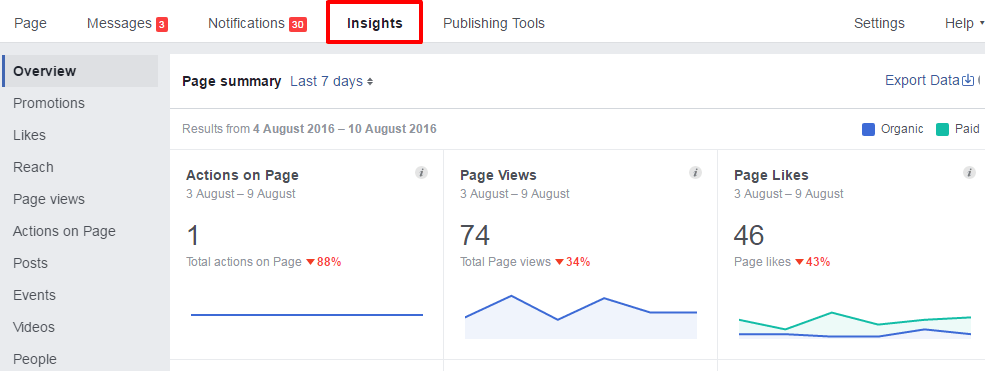
These insights are there by default and you can access them anytime by clicking on Insights link in the menu.
It gets even better with the introduction of Local insights.
If you are a local business, you can see the peak hours when most people are in nearby locations to choose your opening hours. You can also see the age group, gender, and even home location of these people.
This is invaluable information for small businesses that don’t have the budgets to spend on market research or surveys.
Let’s discuss different sections of Facebook Insights and how to use this information as a small business.
Overview:
The overview will give you a quick summary of the likes, reach, engagement, and the actions on the page. You can set it to show statistics from Today, Yesterday, Last 7 days, or Last 28 days.
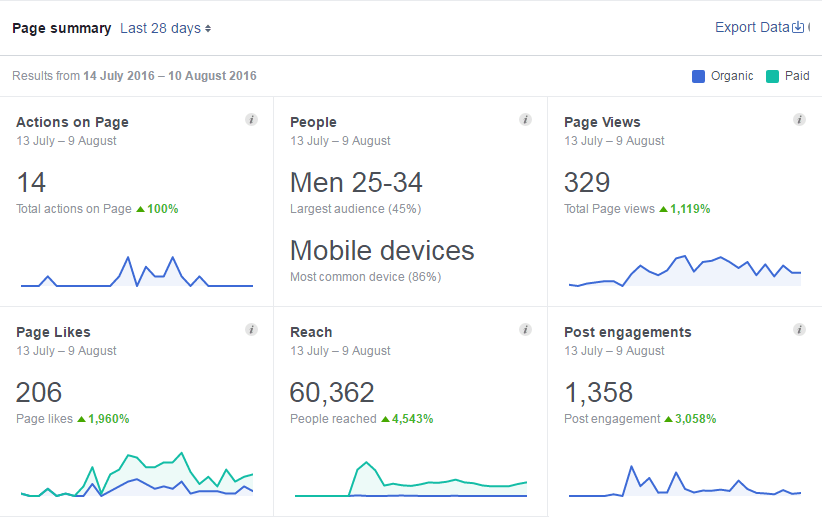
Scroll down and you will find a quick summary of your paid promotions including the cost and the number of people reached.
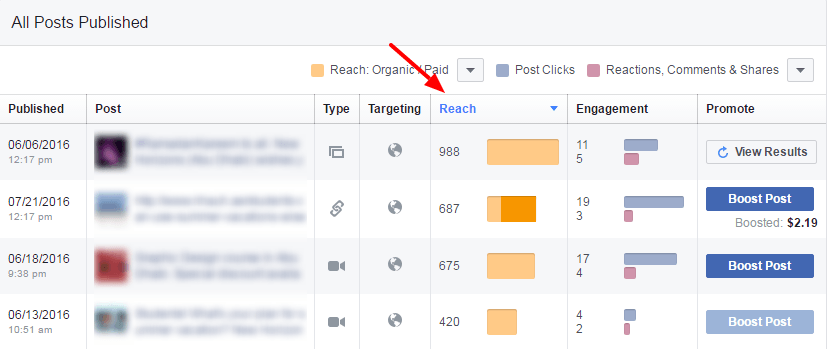
Next, you will find your 5 most viewed posts in that specific time period so you can quickly see the kind of content or posts that will work.
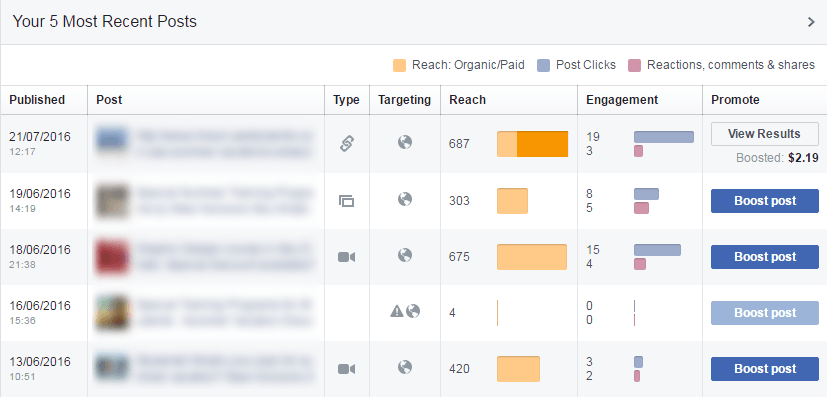
As you can see, link posts have reached the most people but it was pushed by a paid boost. Photo and video posts seem to have the best organic reach.
Then you have a comparison with similar business pages and you can see if your page is doing equally well or lagging far behind.
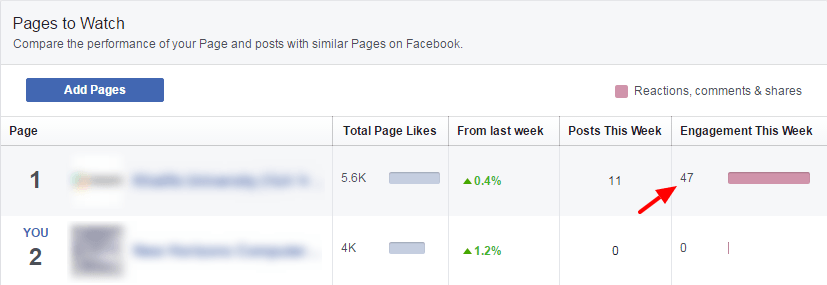
Clearly, the other page has a much better engagement rate. Going through their content and post timings might give you an idea or two?
Facebook will suggest some similar pages or you can also add the Facebook page of your competitors to have the comparison.
Promotions:
Promotions section gives a quick summary of your paid boosts. Complete detail of your paid advertising campaigns can be found in Ads Manager but that’s for another post.
Likes:
Likes section will give you the details about your Page likes.
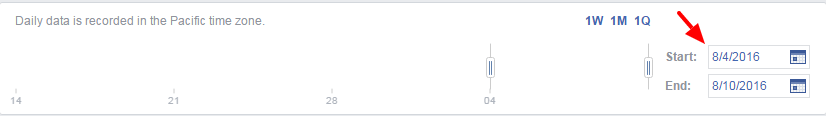
First, you need to choose the “Start” and “End” dates to get the reports for a certain period of time.
This section shows how your page has performed over a period of time and if you are going into the right direction.
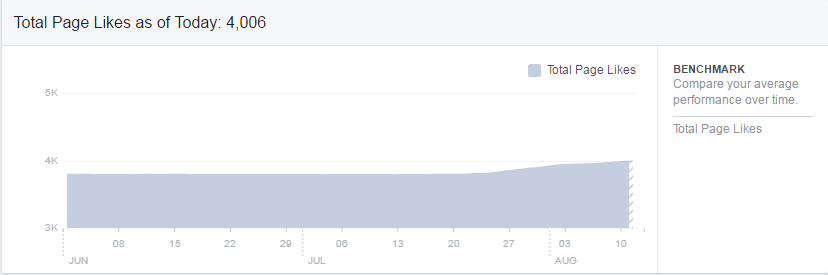
Steady growth shows that you are well on your track and if it’s going down then there’s something wrong and you need to figure out the reason.
Next, you have the “Net likes” graph. It shows the number of likes obtained through organic means, paid promotions, and the unlikes.
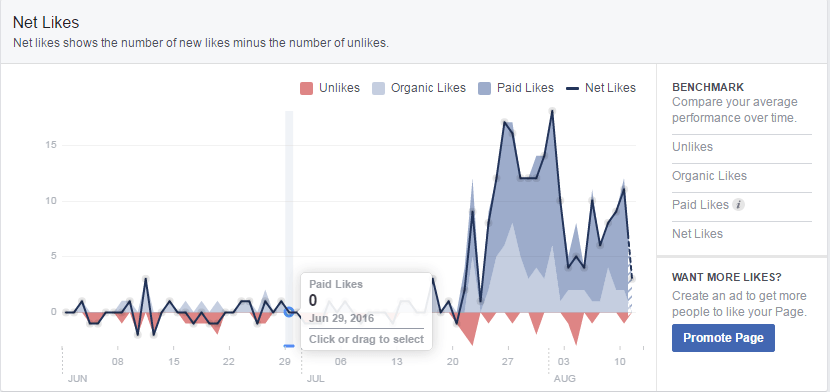
It’s common to have a small number of people to unlike your page but an abnormally high outflow means two things.
First, you are not targeting the right audience and second, you are not posting the right content and you need to make changes in your social media calendar.
You will also find a graph that shows the source of your page likes. You can see if the likes are coming from Ads, from your page, or uncategorized sources.
Reach:
Reach section shows the number of people that you’ve reached on Facebook and how they are reacting to your content.
The first graph shows the number of people your posts reached.
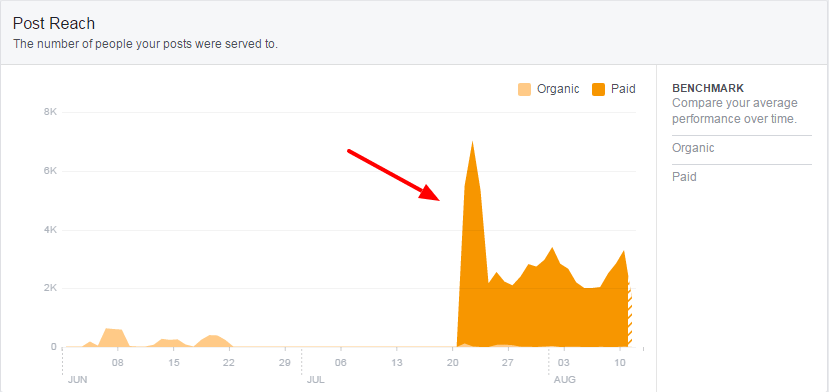
Needless to say that you should be aiming for a stable or slightly upward trend in your post reach. The massive hike (like the one in the screenshot above) or drops can come from starting or ending paid promotions, trying different post types, or posting more regularly.
The next graph shows the response of your target audience. It shows the reactions, comments, or shares that your posts are getting.
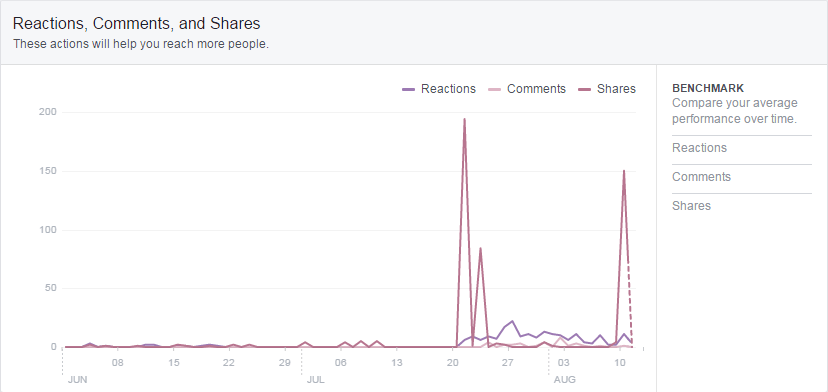
If you’ve read our Facebook Algorithm guide, you will know that your organic reach is parallel to the response your posts get.
If you are getting a lot of reactions, comments, or shares, your organic reach will improve.
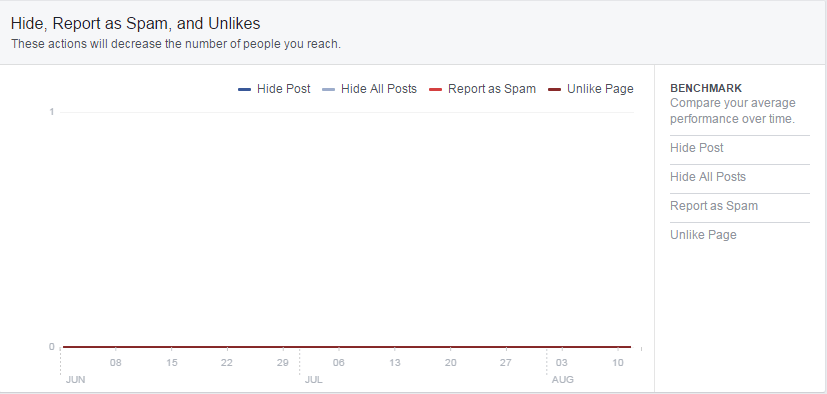
Scroll down if you want to see the kind of reactions your post get.
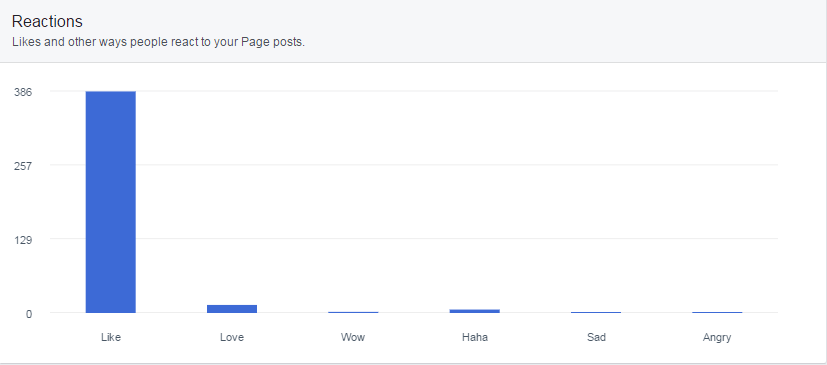
Almost all of these reactions are equally good, at least as far as reach and algorithm are concerned. However, you might want to get more (or less) of a certain reaction, depending on your goals and objectives.
This chart will show if you are achieving your goal.
Just like the Likes or comments improve your organic reach, reactions like “Hide” or “Report as Spam” will do the opposite.
It’s something you need to keep an eye on a regular basis. Make sure that your posts are getting no such reactions.
The section ends with a graph showing your total reach.
Page Views:
Page views are like Google Analytics for your website. You can see how many people have visited your page, sections that they’ve viewed, and the source of traffic.
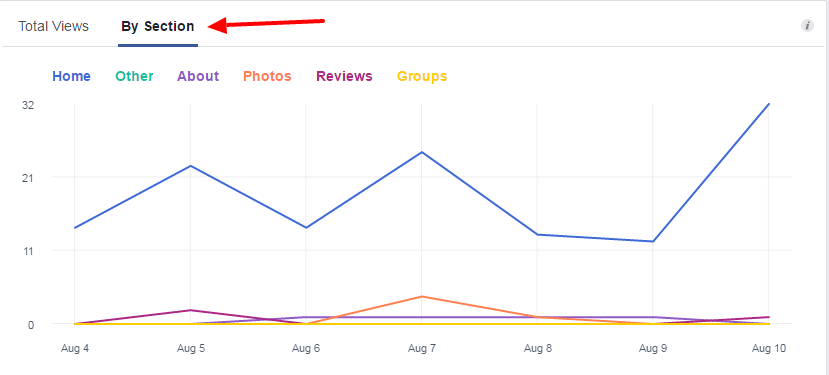
Click on “by Section” to see if visitors are viewing the sections that you want them to see.
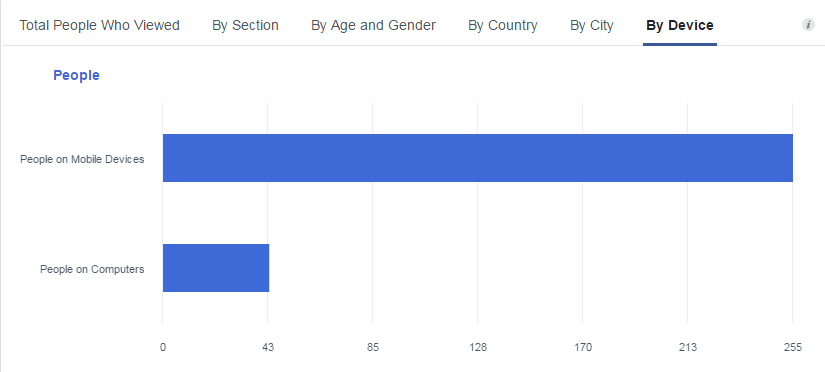
You can see the age and gender of people who have visited your website, their location, and the device that they are using.
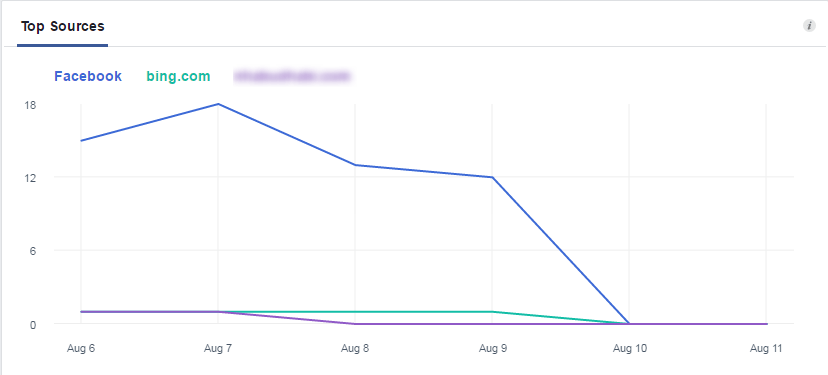
You can also see the source of traffic on your page.
Actions on the Page:
This section will give you the following insights:
- Total Actions on the Page
- People who clicked Action button (by age and gender, country, city, and device)
- People who clicked Get Directions (by age and gender, country, city, and device)
- People who clicked Phone Number (by age and gender, country, city, and device)
- People who clicked Website (by age and gender, country, city, and device)
You can use this information while choosing Target Audience in your paid promotions. For example, if you are creating a campaign to get website clicks, you can target the country or age group that clicked website. If you are looking to get the leads, you can target the ones who have clicked the phone number.
Posts:
Post section gives you all the information that you need to improve your engagement rate and reach.
For example, it tells you the day and time when the majority of your page fans are online.
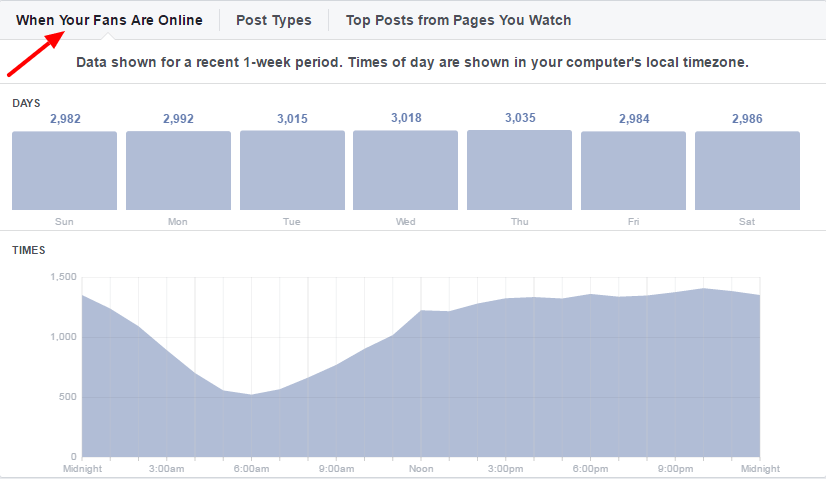
Going by this information a time between 9:30 PM to 10:30 PM will be the best time to post while there’s no big difference between the number of people online on a specific day.
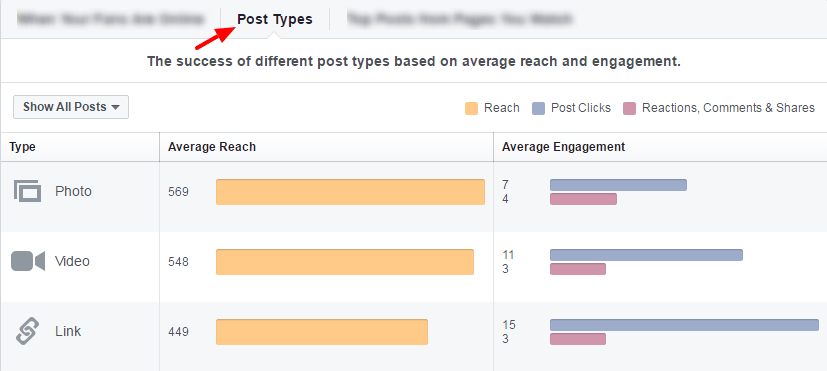
You can also check the average reach and engagement rate for different types of posts.
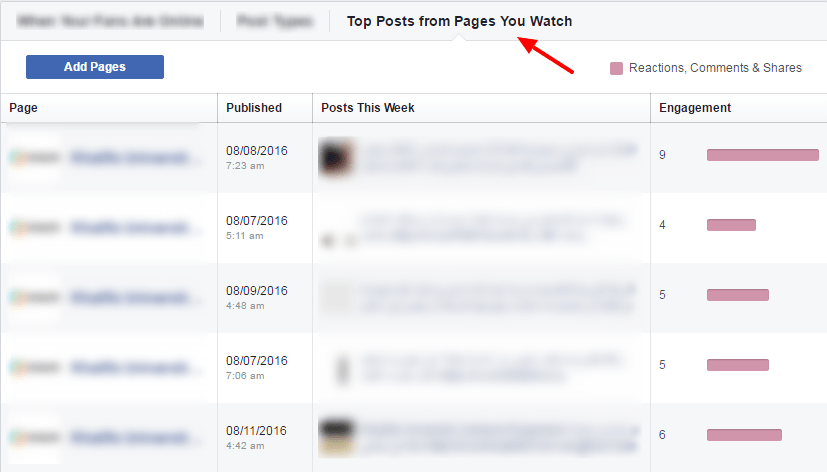
Here’s the most interesting part. You can also see the best performing posts from your competitors or pages that you are keeping an eye on.
If you are running short of ideas and can’t decide what type of content or topics will click with your audience, this section can give you some food for thought.
Then there’s a list of all posts with the reach and engagement rate. You can sort them according to reach or engagement rate.
You can sort this list according to reach engagement rate.